In 1960 the median American family took in $5,620 for the year. A man working full time all year earned about $5,400, a woman about $3,300, and the average worker below the supervisor level made $2.09 an hour. A pound of bread cost about 20 cents, a gallon of gas 31 cents and a stamp 4 cents. The average new car went for $3,030, and the median home was worth $11,900.
| Item | Back then | In today’s money | Price today |
|---|---|---|---|
| White bread, 1 pound | 20¢ in 1960 | $2.31 | $1.83 |
| Milk, 1 gallon (sold by the quart in 1960) | 99¢ in 1960 | $11 | $4.11 |
| Eggs, grade A large, 1 dozen | 57¢ in 1960 | $6.53 | $2.27 |
| Hamburger, 1 pound | 52¢ in 1960 | $5.97 | $6.79 |
| Coffee, 1 pound | 75¢ in 1960 | $8.58 | $9.33 |
| Regular gas, 1 gallon (latest month, August 2026) | 31¢ in 1960 | $3.54 | $4.35 |
| First-class stamp | 4¢ in 1960 | 46¢ | 82¢ |
| Median monthly rent, utilities included (latest Census figure, 2024) | $71.00 in 1960 | $809 | $1,487 |
| New car, average price paid | $3,030 in 1960 | $34,500 | $50,562 |
| Typical home, owner's estimate (latest Census figure, 2024) | $11,900 in 1960 | $136,000 | $360,600 |
“In today’s money” uses the government’s Consumer Price Index.
Across the country, the median family income was $5,620 in 1960, about $64,000 in today’s money. A man who worked full time all year earned about $5,400, and a woman about $3,300. The average worker below the supervisor level made $2.09 an hour, which came to about $80 a week before taxes. If you’ve seen a 1960 “average wage” of about $4,000, that’s Social Security’s national wage index, a different measure from the hourly pay used here.
The government also drew up an ordinary city family for its budgets: a 38-year-old husband with a job, a wife “not employed outside home,” a boy of 13 and a girl of 8. They rented five rooms and a bath. “The wife does all the cooking, cleaning, and laundry without paid help,” the Bureau of Labor Statistics wrote. Her budget gave her a gas or electric stove, a refrigerator and a washing machine.
In the fall of 1959 the bureau priced out a year of the budget family’s life. The level was “modest but adequate,” it said, “neither a ‘minimum maintenance’ nor a ‘luxury’ level.” The budget allowed a used car every three years, the upkeep of a TV set and, for the first time, a telephone.
Even in Houston, the cheapest of the 20 cities priced, that life cost $5,370 a year, close to what the median family had in all. The bureau’s own guess was that big-city families like this one, with a single earner, really made $7,000 to $7,500, well above the national median. The budget kept the wife at home. Among all American women, 56% had some income of their own by 1960, from a job or otherwise, up from 39% in 1947.
What a week’s pay covered
That $80 or so paid for a 38.6-hour week, and factory hands did a little better, at $2.26 an hour. For a couple with two school-age kids, a week’s groceries took $23.70 of it on the Agriculture Department’s low-cost plan for April 1960, more than a quarter of the check. On the liberal plan they took $36.20, closer to half.
Rent was the other bill to plan around. The median, utilities included, was $71 a month, or roughly $16 out of each week’s pay.
What was left of the week went out a nickel or a quarter at a time. A 1-ounce chocolate bar cost a nickel at the store. Milk came two ways in the government’s price list, 24.7 cents a quart at the grocery and 26.0 cents if the milkman left it on the step.
Minutes of work, then and now
Prices 66 years apart are easier to compare in work, counted as the minutes or hours the average worker had to put in to pay for each thing.
| Item | Work in 1960 | Work today |
|---|---|---|
| Bread, 1 lb | 6 minutes | 3 minutes |
| Eggs, 1 dozen | 16 minutes | 4 minutes |
| Milk, 1 gallon | 28 minutes | 8 minutes |
| Hamburger, 1 lb | 15 minutes | 13 minutes |
| Regular gas, 1 gallon | 9 minutes | 8 minutes |
| A month’s rent | 34 hours | 46 hours |
| A new car | 1,450 hours | 1,550 hours |
| A typical home | 5,690 hours | 11,060 hours |
Food got much cheaper in work. A dozen eggs went from 16 minutes to 4 and a gallon of milk from 28 to 8, while hamburger and gas barely moved. Housing went the other way, with a month’s rent rising from 34 hours to 46 and a typical home from about 5,690 hours to 11,060, nearly twice as many. Hours for a new car hardly changed. So pay outran the grocery bill, but not the rent or the price of a house.
Each price is divided by the average worker’s hourly pay in its own year, $2.09 in 1960 and $32.60 in September 2026. The two pay figures come from different government series. In 1964, the first year both cover, the current series ran about 7% higher than the old one, so the 1960 pay may be a bit low and the 1960 minutes a bit long. Rent and the house are Census figures for 1960 and 2024.
The Bureau of Labor Statistics ran the same sum for a factory worker in September 1960, in Table 9 of its Bulletin 1301. It came out at 5 minutes for a pound of bread and 16 for a dozen eggs, within a minute of ours. The bureau used factory pay, $2.26 an hour, where ours is the average worker’s $2.09, which is why bread shows 5 there and 6 in the table. Its point then was that food took less work than it had in 1953.
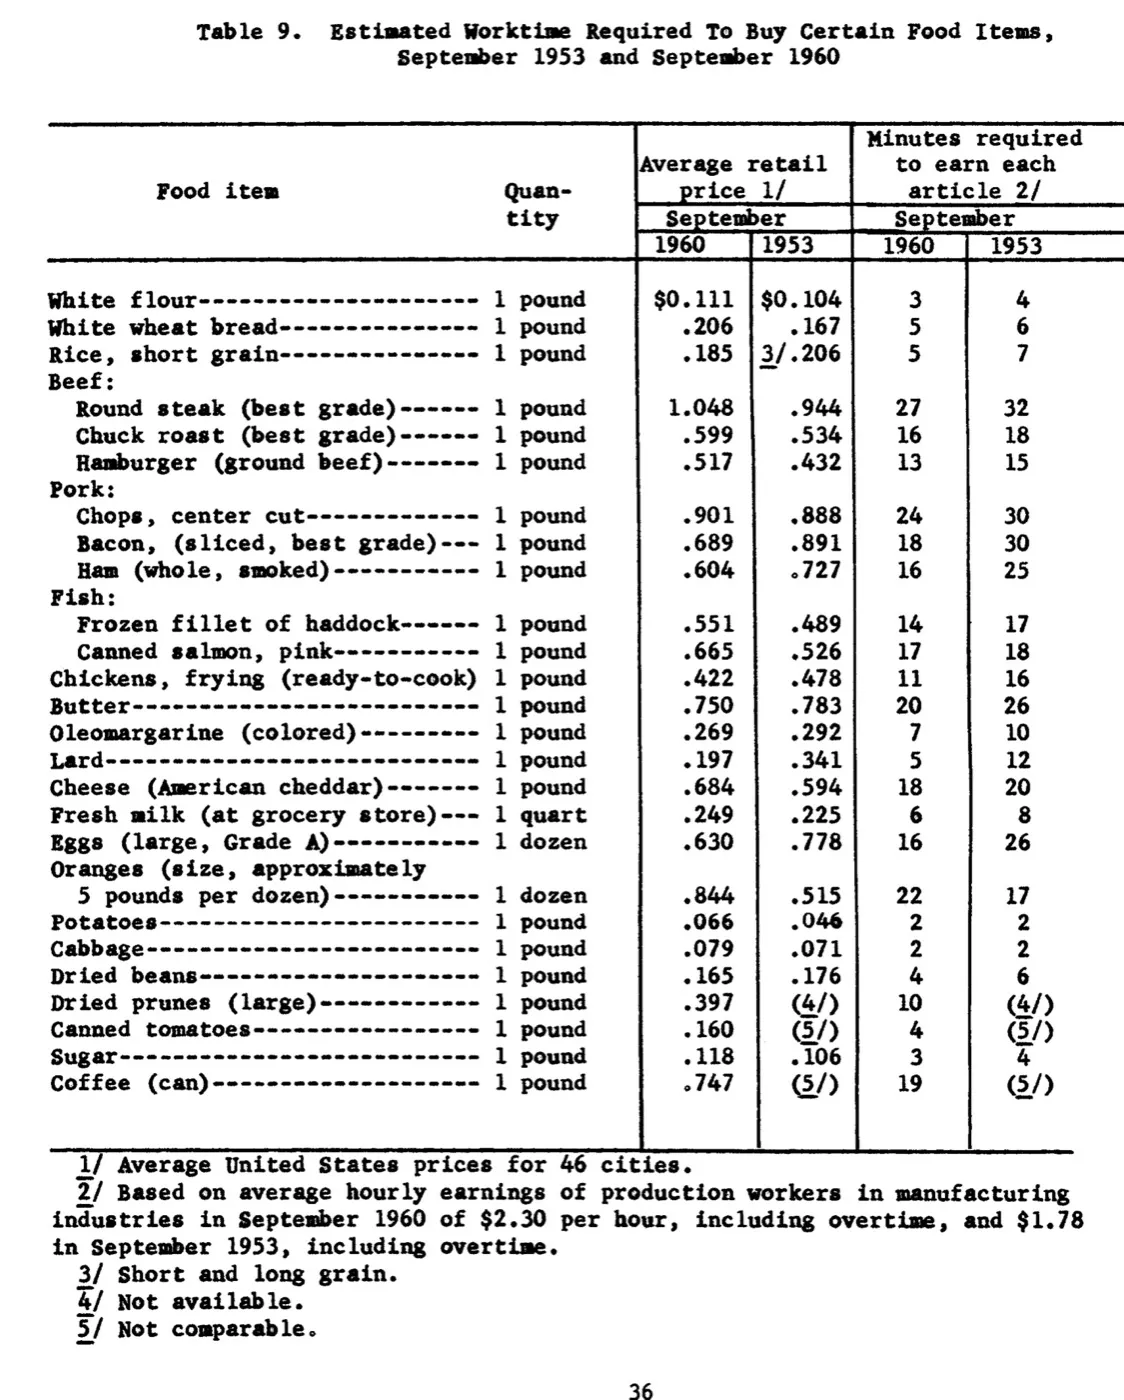
Minutes of work each food cost, 1953 and 1960, from the government’s Bulletin 1301 (1961). U.S. Bureau of Labor Statistics, public domain, via FRASER, Federal Reserve Bank of St. Louis.
A TV for Christmas, on easy terms
A 23-inch Silvertone TV on a lowboy base, “both yours for the TV price only,” went for $179.95 cash or $8.50 a month in the 1960 Sears Christmas Book. The cash price was more than two weeks’ pay for the average worker. A 4-transistor pocket radio in smoke gray was $16.50.
Credit was the pitch on the inside cover, which opened with “IT’S MAGIC!” and promised that with Sears Easy Terms “your Christmas shopping money is increased 10 times in purchasing power!” In Sears’s arithmetic, $30 used as a 10% down payment bought $300 worth of presents. On TV sets, washers, ranges and the other appliances on its list, there was “no monthly payment until February, yes, February!”
New cars went home the same way. Of the people who bought one in 1960, 61% borrowed the money or paid in installments, and by then 77% of families owned a car.
Who made less than the average
Hotel and motel workers got $1.10 an hour. The pay table that printed it carried a footnote, “Money payments only,” because board, room, uniforms and tips weren’t counted. Workers in general-merchandise stores (department stores, five-and-dimes, mail-order houses) made $1.40, and their week ran just 34.7 hours.
Factory pay depended on the state. In Mississippi a factory hand earned $60.50 a week, in Michigan $112.00. Southern families as a whole had about two-thirds of what families in the West took in.
City families had about twice the money income of farm families, whose median was $2,875. Many farmers, the Census Bureau pointed out, got “an important part of their income in the form of goods produced and consumed on the farm rather than in money.” A hired hand earned $6.60 a day without board.
For Black and other nonwhite families, as the tables of the day grouped them, the median was $3,233, a little over half the $5,835 that white families had.
Families headed by someone 65 or older had only $2,900. Counting every family in the country, the Census report found that “somewhat more than one in every five families reported less than $3,000 in money income in 1960.”
The $1 minimum, and who it left out
The federal minimum wage was $1 an hour, where it had stood since March 1, 1956, and it didn’t reach everyone. Large retail and service businesses came under the law only with the 1961 amendments, and laundries and large hotels, motels, restaurants and farms not until 1966.
On May 5, 1961, John F. Kennedy signed the bill that raised it. He said no one working in interstate commerce, for a company of substantial size, should have to work “for less than a dollar twenty-five cents an hour, or fifty dollars a week.” He called that “a very minimum wage.” By his count, the bill brought in 3.6 million people who hadn’t been covered.
Workers the law already reached went to $1.15 that September and $1.25 in 1963. But the newly covered started at $1.00 and didn’t get to $1.25 until Sept. 3, 1965.
By the end of the decade
Prices rose about 24% from 1960 to 1969 by the government’s index. Incomes rose faster, and the median family took in $9,433 in 1969. The average worker’s pay had reached $3.04 an hour, and the minimum had been $1.60 since Feb. 1, 1968.
Regular gas hardly moved, at 34.8 cents a gallon on average in 1969, less than 4 cents above where the decade began. At $3.04 an hour, that gallon took about 7 minutes of work, down from 9 in 1960.
What would it cost today?
$1.00 in 1960 is about $11 in today’s money.
Based on the Consumer Price Index, 1930 to 2025, compared with September 2026.
Questions people ask
How much did a house cost in 1960?
The median owner-occupied home was worth $11,900 by the 1960 Census, which is what owners themselves estimated. For mortgaged one-family homes, counting ones bought in earlier years, the median purchase price was $11,500, and the median payment was $59 a month for principal and interest at a median rate of 5.1%.
How much did a new car cost in 1960?
New-car buyers paid $3,030 on average in 1960, by the University of Michigan’s Survey of Consumer Finances, and a used car averaged $820. Kelley Blue Book put the average new vehicle at $50,562 in September 2026.
How much was a stamp in 1960?
Four cents for a first-class letter, the rate since Aug. 1, 1958. It went to 5 cents on Jan. 7, 1963, and to 6 cents on Jan. 7, 1968. A 1-ounce stamped letter costs 82 cents today.
What is $1 from 1960 worth today?
About $11.39 in September 2026 dollars, by the government’s Consumer Price Index. The calculator on this page converts any 1960 amount the same way.
Written by Wance Payton, Oct. 28, 2026
26 sourcesWhere these facts come from
- U.S. Bureau of Labor Statistics, Retail Prices of Food 1959-60, Bulletin No. 1301, Nov. 1961 (FRASER)
- U.S. Bureau of the Census, Income of Families and Persons in the United States: 1960, Series P-60, No. 37, Jan. 17, 1962
- U.S. Census Bureau, Historical Income Tables: Families, F-5 (race)
- U.S. Census Bureau, Historical Income Tables: Families, F-6 (region)
- U.S. Census Bureau, Historical Income Tables: People, P-38 (full-time, year-round workers)
- Economic Report of the President 1998, Table B-47, Hours and earnings in private nonagricultural industries, 1959-97
- U.S. Bureau of the Census, Statistical Abstract of the United States: 1962, Part 4 (Tables 306, 307, 310)
- U.S. Bureau of the Census, Statistical Abstract of the United States: 1962, Part 5 (Table 470)
- U.S. Bureau of the Census, Statistical Abstract of the United States: 1962, Part 7 (Table 768)
- Helen H. Lamale and Margaret S. Stotz, "The Interim City Worker's Family Budget," Monthly Labor Review, Aug. 1960 (Internet Archive)
- USDA, Family Economics Review, June 1960, "Estimated Cost of One Week's Food, April 1960" (Internet Archive)
- Sears, Roebuck and Co., Sears Christmas Book 1960 (Internet Archive)
- U.S. Department of Labor, History of Changes to the Minimum Wage Law
- John F. Kennedy, Remarks Upon Signing the Minimum Wage Bill, May 5, 1961 (The American Presidency Project)
- Social Security Administration, National Average Wage Index
- U.S. Bureau of Labor Statistics, Average hourly and weekly earnings of production and nonsupervisory employees, total private
- U.S. Bureau of Labor Statistics, CPI Average Price Data (bread, ground beef, eggs, milk, coffee)
- U.S. Energy Information Administration, Monthly Energy Review, Table 9.4, Retail Motor Gasoline Prices
- USPS Historian, Rates for Domestic Letters Since 1863
- USPS Postal Explorer, Notice 123 Price List
- U.S. Census Bureau, Historical Census of Housing Tables, Median Gross Rents
- U.S. Census Bureau, Historical Census of Housing Tables: Home Values
- U.S. Census Bureau, Census of Housing 1960, Vol. 5, Residential Finance
- U.S. Census Bureau, American Community Survey 2024, median gross rent (B25064) and median value (B25077)
- Cox Automotive / Kelley Blue Book, September 2026 average transaction price report, Oct. 13, 2026
- U.S. Bureau of Labor Statistics, Consumer Price Index (CPI-U)