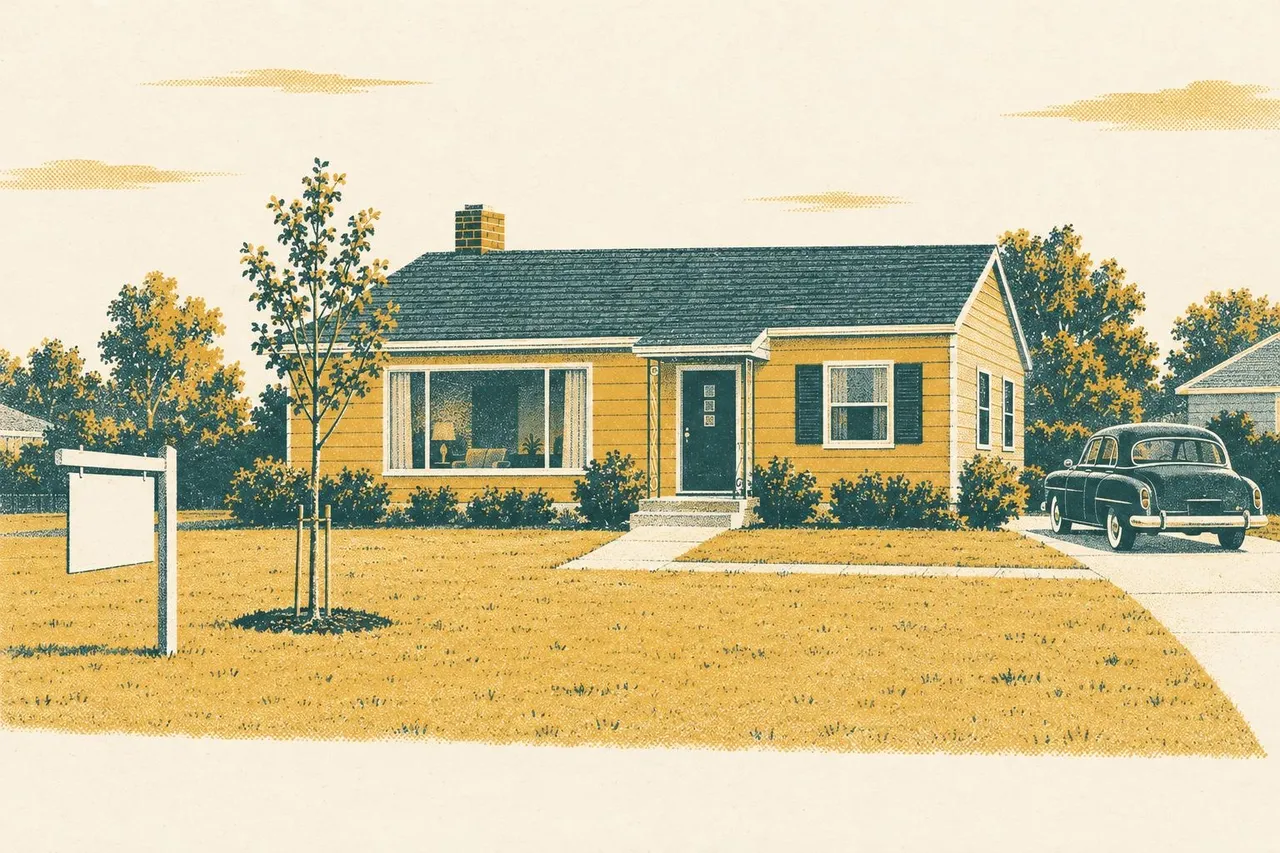
By the Census count the typical owner-occupied home was worth $7,354 in 1950, $11,900 in 1960 and $17,000 in 1970, about $103,000, $136,000 and $148,000 in today’s money. Those are owners’ own estimates, not sale prices. A new house sold for a median of $23,400 in 1970.
| Item | Back then | In today’s money |
|---|---|---|
| Typical home, owner's estimate (Census, 1950) | $7,354 in 1950 | $103,000 |
| Typical home, owner's estimate (Census, 1960) | $11,900 in 1960 | $136,000 |
| Typical home, owner's estimate (Census, 1970) | $17,000 in 1970 | $148,000 |
| Typical home, owner's estimate (Census survey, 2024; counts more home types) | $360,600 in 2024 | $387,000 |
| New house actually sold, land included (Census median, 1963) | $18,000 in 1963 | $198,000 |
| New house actually sold, land included (Census median, 1970) | $23,400 in 1970 | $203,000 |
| New house actually sold, land included (Census median, 2024) | $420,300 in 2024 | $451,000 |
| Levittown, N.Y., house (1949) | $7,990 in 1949 | $113,000 |
| Two-bedroom house, Carrboro, N.C. (newspaper ad, 1957) | $7,500 in 1957 | $90,000 |
| Three-bedroom house, FHA approved, Chapel Hill, N.C. (newspaper ad, 1959) | $14,250 in 1959 | $165,000 |
| Median family income for the year (1950) | $3,319 in 1950 | $46,500 |
| Median family income for the year (2024) | $105,300 in 2024 | $113,000 |
“In today’s money” uses the government’s Consumer Price Index.
The 1950 figure, $7,354, is the one you’ve probably seen. It turns up on Reddit, on real estate sites and in article after article, often called the “average price” of a house and sometimes the price of a new one.
Neither label fits what the Census Bureau measured, which its 1950 Census of Housing describes as the median of what owners “estimated their properties would sell for.” So it’s what people thought the house they lived in would bring. It also mixes town and country, since the median home in cities and towns was put at $8,380 and the one in the countryside at $4,878, farms not counted.
The Census published the same kind of figure in 1960 and 1970, so the three line up. Adjusted for inflation, as in the table above, they show the typical home’s value rising faster than prices in general in both decades.
What did buyers actually pay?
Sale prices are harder to pin down, since the Census series on new houses sold only begins in 1963. Before that, prices mostly come house by house, and old newspaper ads are the closest thing to a price list. The ones here come from North Carolina, where the small-town weeklies are scanned and online.
In Carrboro, a two-bedroom house with a pine-paneled living room was advertised in 1957 as “Priced at only $7,500.” There’s other houses on that page too, among them a three-bedroom brick one on Severin Street at $13,500.
Two years later a Chapel Hill ad offered a four-year-old three-bedroom with a screened porch for $750 down, “FHA approved and reasonably priced at $14,250.” That meant the Federal Housing Administration would insure a mortgage on it. The same page carries a second, smaller ad for the house, with the same phone number. It calls the place a brick rambler on a large wooded lot, to be sold with or without the appliances, and names the loan, a “4½% FHA loan.”
Those are asking prices in and around a college town, the ads don’t say what the houses finally went for. A builder’s set price is firmer. Back in 1949 the Levitts sold their ranch houses in Levittown, N.Y., the big postwar development on Long Island, at one fixed price, $7,990.
In 1963, the first year of that count of new houses sold, the median new house went for $18,000, lot included. Seven years later it was $23,400, well above the $17,000 owners put on their homes that year. But the sales count covered only new houses, and the Census value took in old ones too.
Why the old prices look so low
A yearly Census survey, which also counts condos and mobile homes, put the typical home at $360,600 in 2024. That’s about $387,000 in today’s dollars, pretty near four times the 1950 home’s $103,000.
Part of the gap is the house itself. A typical new house in 1950 was nothing fancy, with two bedrooms, one bath and less than 1,000 square feet. By 1956, 70 percent of new houses had three bedrooms. And the median new house grew from 1,525 square feet in 1973, the first year in the Census Bureau’s online table, to a peak of 2,467 in 2015. In 2025 it was 2,142.
A price brought up to date also leaves out pay, and families take in far more now than in 1950, even after inflation. So divide the typical home’s value by the median family income for the year. Measured that way the 1950 house cost about two-thirds as much as today’s, where the inflation-adjusted figures make it look like little more than a quarter.
| Year | Typical home | Median family income | Years of income |
|---|---|---|---|
| 1950 | $7,354 | $3,319 | 2.2 |
| 1960 | $11,900 | $5,620 | 2.1 |
| 1970 | $17,000 | $9,867 | 1.7 |
| 2024 | $360,600 | $105,300 | 3.4 |
Family pay grew faster than home values through the 1950s and ’60s, which is why the ratio fell by 1970.
The monthly bill and the down payment
In 1950 fewer than half of owner-occupied homes had a mortgage at all, 44 percent in that year’s census. Those that did were cheap to carry. GI loans, which the Veterans Administration guaranteed, ran almost entirely at 4 percent, and conventional loans typically at 5 percent.
On loans that cheap, the median monthly payment on a first mortgage was $37 for principal and interest. That takes in every loan on the books in 1950, old ones along with new. Rent that year ran a median $35 a month, so a family paying off a house paid more or less what renters did, plus taxes and insurance.
By the end of the decade a Census survey taken from late 1959 into early 1960 put a whole purchase together. These are its median answers for homeowners still paying on a loan:
- What they’d paid for the house, whenever they bought it: $11,500
- Share of the price the first mortgage covered: 79 percent, leaving about a fifth for the buyer to find
- Length and rate of the loan: 20 years at 5.1 percent
- The monthly payment on the loan: $59
Buyers with a VA loan had far less to find, since the median VA loan in that survey covered 91 percent of the price and a conventional loan just 68 percent. Under looser rules it had put in place on Oct. 2, 1952, the VA required no down payment from a veteran buying a house of $8,000 or less, only the closing costs in cash.
Who was allowed to buy
In 1949 Gene Burnett, a veteran, saw the Levittown ads in the New York papers and drove out to Long Island with his fiancée. A salesman there wouldn’t give him an application form. “It’s not me,” the agent said. “The builders have not at this time decided to sell to Negroes.” Levittown’s rule went back to 1947, when its first rental contracts said no house could “be used or occupied by any person other than members of the Caucasian race.”
The FHA, whose insurance stood behind loans like the Chapel Hill one, wrote the same idea into its own rules. Its Underwriting Manual of 1938 told appraisers that for a neighborhood “to retain stability,” its houses had to “continue to be occupied by the same social and racial classes.” It also recommended deed restrictions against “the occupancy of properties except by the race for which they are intended.”
From February 1950 the FHA refused to insure houses with a newly filed racial covenant. The covenants already on thousands of FHA-insured homes were left alone. As late as 1959, by an estimate the U.S. Commission on Civil Rights cited, minority buyers, whatever they earned, had been able to get into under 2 percent of the homes the FHA had insured since the war.
President Kennedy’s order of Nov. 20, 1962, was the first by a president against discrimination in housing. It reached mostly FHA and VA homes, and only those insured or guaranteed after that date, barely 1 percent of the nation’s housing. Title VIII of the Civil Rights Act of 1968, the federal fair housing law, went much further and barred discrimination by real estate brokers, builders and mortgage lenders.
Into the 1970s
Counted in the dollars of the day the typical home’s value nearly tripled over the decade, from $17,000 in 1970 to $47,200 in 1980. No other decade from 1940 to 2000 saw it grow by so large a share. Most of that was inflation. In 2026 dollars the climb was from about $148,000 to $193,000, close to a third, much as in the 1950s.
Borrowing for those houses got costlier as well. Freddie Mac’s weekly survey of mortgage rates began in April 1971 at 7.33 percent and rose to its highest reading, 18.63 percent, in October 1981. That first reading is almost exactly where the same survey stood in mid-October 2026, at 7.40 percent.
Looking up a house in your state
The Census kept the same figures for every state, so you can look up your own.
- Open the Census Bureau’s historical home values table page and choose the one marked “Unadjusted,” which runs from 1940 to 2000 with no inflation adjustment.
- Find your state and the census year nearest the one you want. Ohio, for one, went from $8,304 in 1950 to $13,400 in 1960 and $17,600 in 1970.
- Put that figure and its year into the calculator at the bottom of this page.
- Keep in mind it’s a statewide median that mixes town and country, the way the national figure does.
What would it cost today?
$1.00 in 1950 is about $14 in today’s money.
Based on the Consumer Price Index, 1930 to 2025, compared with September 2026.
Questions people ask
How much was a house in 1970?
The typical owner-occupied home was worth $17,000 by the 1970 Census count, which is what owners estimated. A new house actually sold that year went for a median of $23,400, land included.
Was $7,354 the average price of a new house in 1950?
No. It’s the median value of owner-occupied homes in the 1950 Census, meaning what owners estimated their houses would sell for. It wasn’t a sale price, it wasn’t limited to new houses and it wasn’t an average.
How much did a mansion cost in 1960?
The Census didn’t track mansions. In 1960 only about 3 percent of mortgaged one-family homes were valued at $35,000 or more, about $399,000 after inflation.
How much did a house cost in 1940?
The typical owner-occupied home was worth $2,938 in the 1940 Census, about $70,700 now.
Written by Wance Payton, Oct. 22, 2026
22 sourcesWhere these facts come from
- U.S. Census Bureau, Census of Housing 1950, Vol. 1, General Characteristics
- U.S. Census Bureau, Historical Census of Housing Tables: Home Values
- U.S. Census Bureau, American Community Survey 2024, median value (B25077)
- U.S. Census Bureau and HUD, Median and average sales price of new houses sold
- U.S. Census Bureau, Characteristics of New Housing, square footage
- U.S. Census Bureau, Historical income tables, families (F-5)
- U.S. Census Bureau, Census of Housing 1950, Vol. 4, Residential Financing
- U.S. Census Bureau, Census of Housing 1960, Vol. 5, Residential Finance
- U.S. Census Bureau, Census of Housing 1960, Vol. 5, Residential Finance, Table 2
- Freddie Mac, 30-year fixed mortgage rate (via FRED)
- American Heritage, on Levittown
- Newspaper ads, Chapel Hill area, Sept. 20, 1957, p. 6 (DigitalNC)
- Newspaper ads, Chapel Hill area, May 7, 1959, p. 7 (DigitalNC)
- U.S. Bureau of Labor Statistics, Consumer Price Index (CPI-U)
- U.S. Bureau of Labor Statistics, Bulletin No. 1231, New Housing and Its Materials, 1940–56 (1958)
- Smithsonian Associates, "Levittown: A Prototype Emerges", lecture handout, 2025
- The Kings Mountain Herald, "Credit Relaxed On VA Loans", Oct. 9, 1952, p. 6 (DigitalNC)
- U.S. Census Bureau and HUD, Median sales price for new houses sold (via FRED)
- Federal Housing Administration, Underwriting Manual, revised Feb. 1938 (via FRASER)
- National Museum of African American History and Culture, "Restrictive Covenants and Redlining"
- U.S. Commission on Civil Rights, Understanding Fair Housing, Clearinghouse Publication 42, Feb. 1973
- Federal Reserve History, "Redlining", June 2, 2023