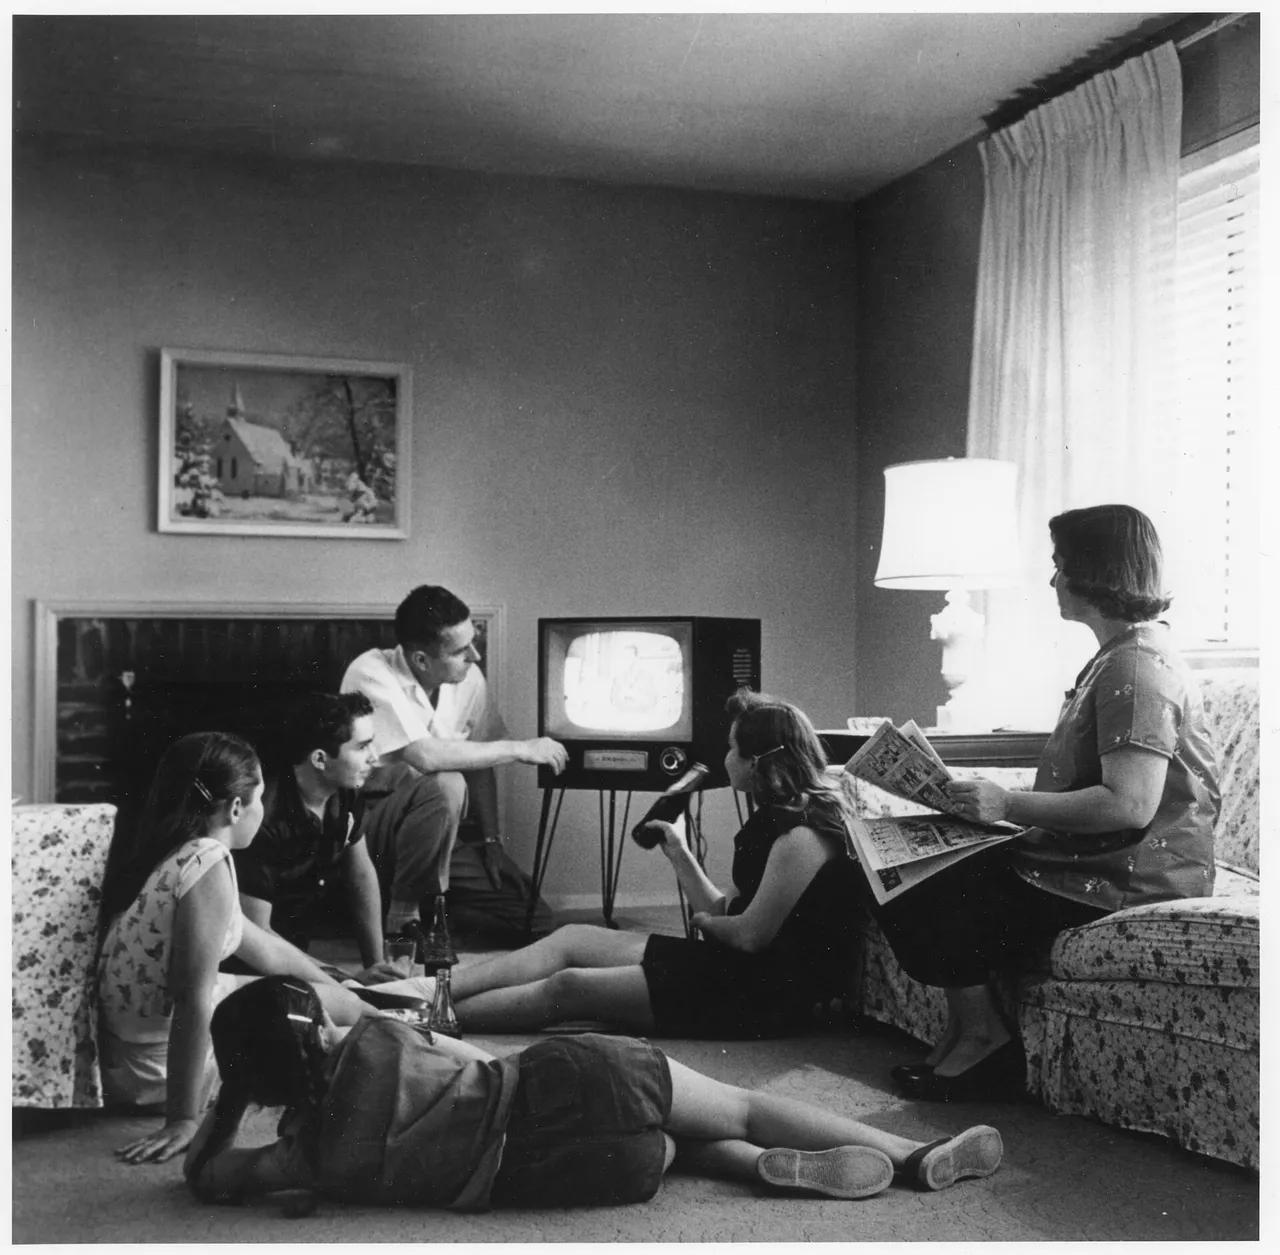
In 1950 the average American household had 3.37 people, and fewer than one married woman in four worked or was looking for work. A full-time homemaker put in about 50 hours a week of housework. By 1955 about two homes in three had a TV, and in a TV home the set was on about five hours a day.
If the radio was on at breakfast in 1953, it was most likely playing in the kitchen. Of the women who listened during breakfast that year, 80% heard it there, and so did 81% of the men. Television was the newcomer, and its early-morning shows were made for the whole family, which, in Leo Bogart’s words, “has not yet split up for school and work.”
Bogart’s 1956 book, The Age of Television, gathered the surveys of those years, and much of this day comes from it. The surveys quoted here are mostly from 1950 to 1952, and the families in them already owned a set. Counts for 1950 put a set in only 7% to 12% of homes, depending on who did the counting, and by 1955 about two homes in three had one. So the TV evening those surveys describe was the early owners’ evening, and most of the country reached it by the middle of the decade.
Mom’s day at home
Once the family had gone its separate ways the TV day changed with it. From mid-morning on, the programs were made for the woman at home, and they stayed that way until late afternoon, when the children were back from school.
In the house itself, four homes in five had a mechanical refrigerator by 1950 and seven in ten had an electric washer. Yet about one home in three still didn’t have complete plumbing, which meant hot and cold running water, a tub or shower and a flush toilet.
The hours of housework, as the economist Valerie Ramey found them, hardly moved. She went through the time studies of full-time homemakers from the 1920s through the 1950s. They averaged close to 52 hours a week, and she saw little sign of change from one decade to the next or between farm and town.
The school day and lunch
About three pupils in ten rode to school at public expense in 1949–50. The numbers grew with the public schools, which had about 11 million more pupils by 1959–60 than a decade before, 36 million in all.
The school year ran about 178 days, and the average pupil was there for about 158 of them.
Lunch, for the children who ate it at school, followed the federal “Type A” rules. As a 1962 USDA bulletin spelled them out, it had to include, at the least, “a protein-rich food, a generous serving of fruits and vegetables, bread, and butter or fortified margarine, and one-half pint of milk.”
After school, Howdy Doody and the homework
Late afternoon was the children’s part of the TV day. In one week of January 1952, half of the 7- and 8-year-olds in an American Research Bureau survey watched Howdy Doody.
In Chicago, homework mostly came first. A 1951 survey there found 69% of children in TV homes did it before they watched, and 2% admitted to having the set on while they worked.
Atlanta parents couldn’t agree on what the set did to chores. Some said the children needed more prodding once it came, and others said “they hurry to get done now” so they could watch.
Supper and the “lap meal”
In Atlanta, 97% of TV families hadn’t moved their supper hour since the set arrived. But 44% now ate within sight of it.
“The family supper table has become a lap meal,” one parent told Better Homes & Gardens. Its survey of parents, most of them upper-middle-class, found that one family in three let the child watch TV while eating supper.
The evening set, and later bedtimes
“We sit and eat popcorn,” one Atlanta housewife told Raymond Stewart, who surveyed set owners there in 1951. Another said, “Before television, my husband would come in and go to bed. Now we spend some time together.”
On a Monday night in the big cities Nielsen measured, a third of the sets were on between 6 and 7 p.m. Between 9 and 10 it was 63%, the high for the night.
Families in a Boston study didn’t talk much over it, and 29% said nobody talked at all while the set was on. Picking the program led to some arguing in about 30% of the TV families in the study town called “Videotown” and in half of those homes father got his way.
Bedtimes slid later with TV in the house. Before television, 63% of the people interviewed in an early-1951 survey were usually asleep between 11 p.m. and midnight. Once they had a set, 75% were watching at that hour.
A third of the Atlanta parents said television had changed the youngsters’ bedtime. In Boston, about a third of the mothers in a 1950 study said it was hard to get them to bed at the usual hour. One mother in another survey of parents reported “no difficulties at all” and explained that “we adjust our schedule to television.”
The week’s groceries
The USDA’s 1950 cookbook, Family Fare, opened with a question: “Are you one of this country’s 45,000,000 homemakers—and trying to do a blue-ribbon job of feeding a family well?”
For one week in the spring of 1955, a USDA survey tallied what city families ate and what it cost. A family in the middle income group, which earned $4,000 to $4,999 a year, spent $31.60 on food that week, about $398 after inflation.
Kept up for a year, that’s about $1,640, or 37% of the roughly $4,500 a family like that had to live on. The share comes from one survey week of city families and isn’t a measure of what the whole country spent.
A half gallon of milk in the cities cost 41 cents in 1950, about 15 minutes’ pay for the average factory worker. A pound of round steak took more than half an hour’s.
Plenty of food was put up at home, too: the average household canned or froze 160 pounds of it in 1954, some of it bought for the purpose, and the average farm family put up 636. What did come from a store came more and more off a self-service shelf. By the mid-’50s those stores took in over four of every five dollars spent on groceries, up from three in ten in 1939.
Then and now
| Then | Now | |
|---|---|---|
| People per household | 3.37 (1950) | 2.50 (2025) |
| Median family income | $3,319 (1950), $46,466 in today’s money | $110,500 (2025) |
| Pupils carried to school at public expense | 31.2% (1949–50) | 51.4% (2018–19) |
| Americans who belonged to a church | 73% (1952) | 47% (2020) |
Who this picture leaves out
The homes still waiting for a set weren’t the only ones the picture missed. On Dec. 24, 1956, LIFE ran a story on a busy Los Angeles wife, Marjorie Sutton, and granted that at 32 she was lucky. “She has a spacious home, a gardener and a full-time maid,” the magazine wrote. She made clothes for her four children and reckoned she entertained 1,500 guests a year.
Her husband earned an average of $25,000, about $310,000 now, a far cry from the median family’s $4,780 that year, about $59,000 today.
By 1960 about two in five married mothers whose children were all in school were working or looking for work. The employed wife, a USDA report found, “simply didn’t do much baking” and “bought ready-baked bread, rolls, and cakes from the store instead.” Employed married women in a 1952 study still put in close to 29 hours a week of housework.
One American in ten was Black in 1950. Census income figures from those years lump Black families together with other nonwhite families, and that group’s median income that year was a little over half what white families made. Black and other nonwhite women were more likely to be in the labor force, 46.1% of them in 1955 against 34.5% of white women. Fewer Black Americans than white ones owned a TV set, too.
More than one American in seven lived on a farm in 1950, 23 million people in all. Wisconsin farm wives in a 1953 study averaged about 53 hours a week of homemaking. Time studies of farm wives also found another 9 to 11 hours a week of farm work on top of the homemaking.
Television got to farm homes late, with a set in only 3% of them in 1950 and in 73% by 1959. In a December 1952 survey of farm families who read Successful Farming, the ones who already owned a set lived an average of 43 miles from the nearest TV station.
Questions people ask
What was the average size of a family in the 1950s?
About three and a half people. The Census Bureau counted 3.54 people per family in 1950 and 3.67 in 1960. Households, which also count people living alone, averaged 3.37 in 1950. In 2025 the figures were 3.15 per family and 2.50 per household.
How many families had a car or a telephone in the 1950s?
In 1950, 59% of families owned a car (7% had two or more) and 41% had none. By 1960 it was 77%, with 15% owning two or more. A telephone was in 61.8% of households in 1950 and 78.3% in 1960, and in 1960 it was in 81% of homes with children between 6 and 17.
When did most American homes get a TV?
Most got one between 1950 and 1955. Counts for 1950 run from 7% to 12% of homes, depending on who did the counting. For 1955 Nielsen gives 64.5% and a Census survey 67.2%, and by 1960 close to nine homes in ten had a set (87.1% by Nielsen, 88% by the Census).
Did most families go to church every Sunday in the 1950s?
No count from the time measures every Sunday, but about half had been in any given week. Gallup’s count of Americans who had attended a religious service in the past week reached its high, 49%, in 1955 and again in 1958. Membership ran higher, at 73% in 1952, against 47% who said they belonged to a church, synagogue or mosque in 2020.
Written by Wance Payton, Oct. 18, 2026
24 sourcesWhere these facts come from
- Leo Bogart, "The Age of Television," Frederick Ungar, 1956
- U.S. Census Bureau, "Historical Statistics of the United States, Colonial Times to 1970," Bicentennial Edition, 1975
- U.S. Census Bureau, Table HH-6, "Average Population Per Household and Family: 1940 to Present"
- U.S. Census Bureau, Table F-7, "Median and Mean Family Income of All Families by Type of Family: 1947 to 2025"
- U.S. Census Bureau, Table F-5, "Median and Mean Family Income by Race and Hispanic Origin of Householder: 1947 to 2025"
- U.S. Census Bureau, "Historical Census of Housing Tables: Plumbing Facilities"
- Campbell Gibson and Kay Jung, U.S. Census Bureau Working Paper 56, Table 1, "United States – Race and Hispanic Origin: 1790 to 1990," 2002
- USDA, "Income Differences in Family Food Consumption and Dietary Levels," Family Economics Review, June 1957
- USDA, "Home Freezing and Canning by Households in the United States," Family Economics Review, October 1957
- USDA, Family Economics Review, December 1959, outlook for 1960
- USDA, "Food Consumption and Dietary Levels of Households with Employed and Nonemployed Homemakers," Family Economics Review, June 1960
- USDA, "Food Distribution Programs of the Department of Agriculture," Family Economics Review, March 1962
- USDA, "Census Counts Telephones and Television Sets," Family Economics Review, September 1961
- USDA, "Family Fare: Food Management and Recipes," Home and Garden Bulletin No. 1, 1950
- Bureau of Labor Statistics, "100 Years of U.S. Consumer Spending," Report 991, 2006
- Valerie A. Ramey, "Time Spent in Home Production in the 20th Century: New Estimates from Old Data," NBER Working Paper 13985, 2008
- National Center for Education Statistics, Digest of Education Statistics 2022, Table 236.90
- National Center for Education Statistics, Digest of Education Statistics 2022, Table 201.10
- LIFE, "Busy Wife's Achievements," Dec. 24, 1956, p. 41
- TVB, "National TV Household Penetration Trends" (Nielsen data)
- Los Angeles Times, Sept. 1, 1960, reprinted by the Los Angeles Daily Mirror blog
- Scott Pelley, "Evening News marks golden anniversary of 30-minute broadcast," CBS News, Sept. 2, 2013
- Gallup, "Easter Season Finds a Religious Nation," April 13, 2001
- Jeffrey M. Jones, "U.S. Church Membership Falls Below Majority for First Time," Gallup, March 29, 2021